| Home - Support - Downloads - Order |

| Purchase
Tide Plotter online for only £10.99
Download
an evaluation copy to see
it in action. Find out exactly what Tide Plotter can do by visiting our features page. What Ports are included? Here is a complete list. Read what the press have been saying about Tide Plotter on our reviews page.
|
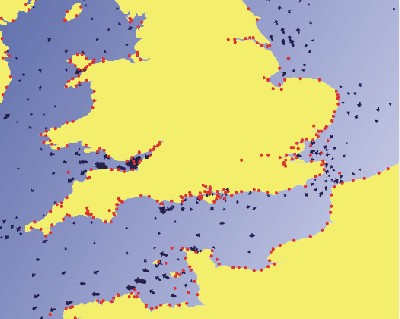
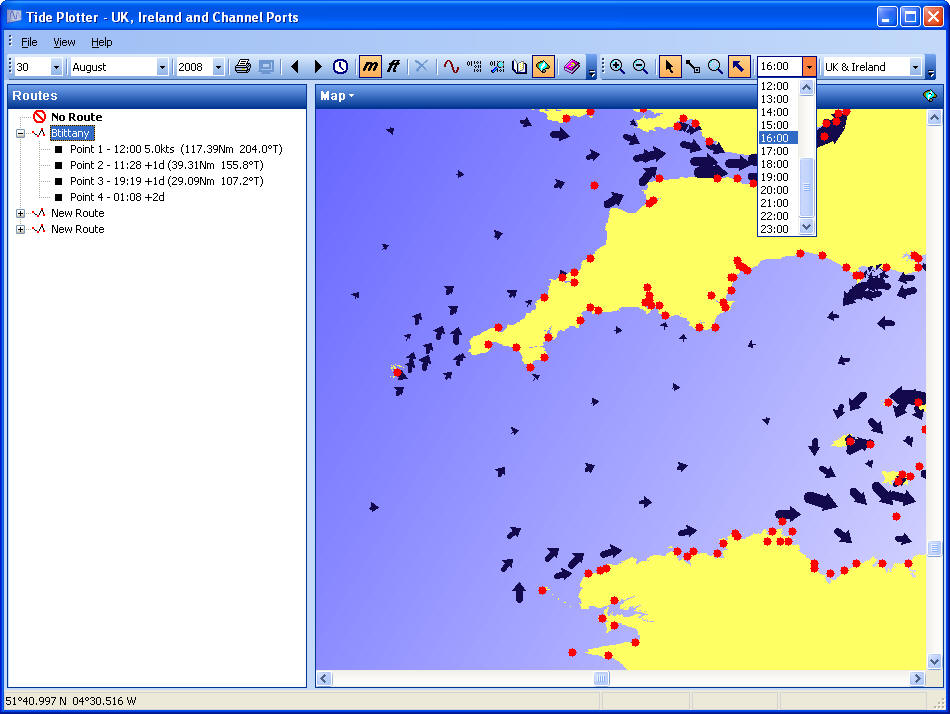
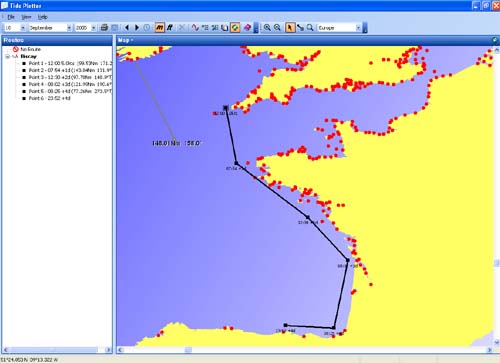 A Scale map screen shows all the ports. You can also draw routes indicating distances, bearing and passage time. There is an additional tidal streams add on which will work out the tidal vectors.
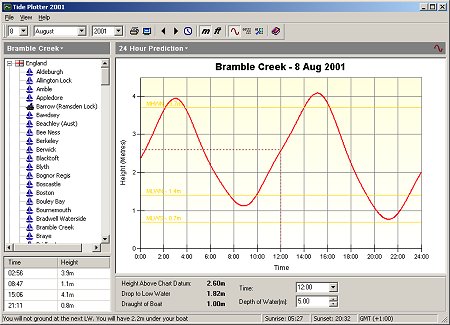
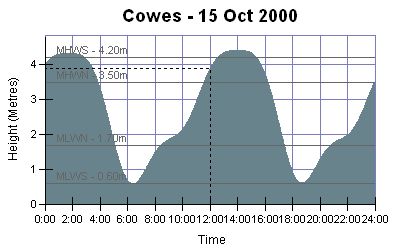
Tide Plotter showing a daily graph for Dublin
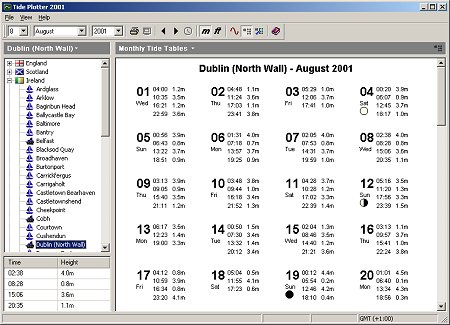
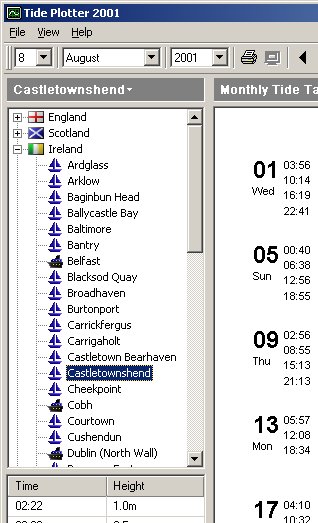
Tide Plotter showing a monthly table for Conwy N. Wales
Tidal stream information is given taken from chart
diamonds
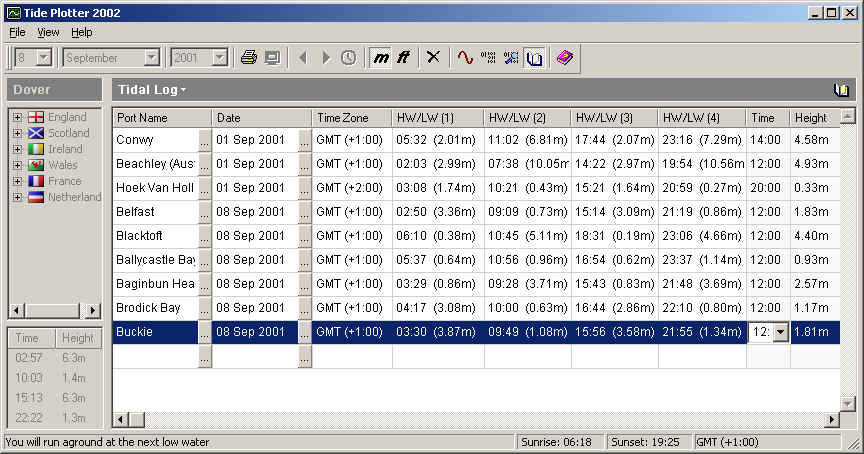
Tide log enables you to keep a record of HW & LW plus heights
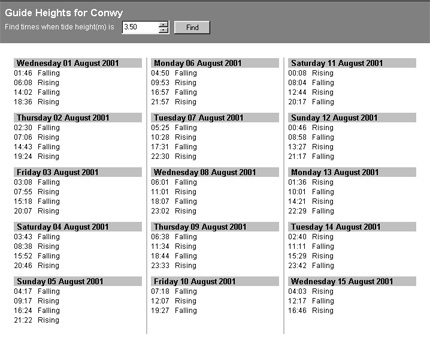
Tide Plotter can produce tables for any port giving times at a given height
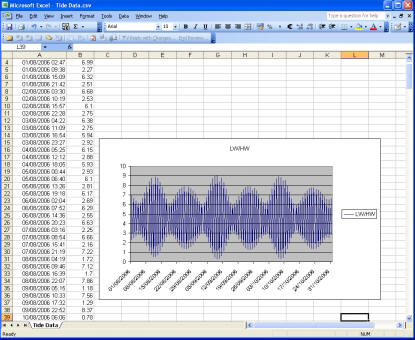
Export data into a spreadsheet
Ports are selected quickly and easily from the tree and a date from the toolbar.
Graphs can be exported for use in other programs.
|